Why Data Mixture Gets Stranger the More You Clean It (Part 1)
DataMining · November 6, 2026
Let us be clear up front. When most people hear "large model training", their first reaction is "more data, more compute, more parameters". But anyone who has actually done the work knows the bottleneck is no longer whether you have data — it is how you use the data you have.
From around 2018 to today, the core change in pre-training comes down to three steps:
- Cleaning data (subtraction): raw internet text is full of duplicates, low-quality pages and contaminated content. Leave it in and the model learns garbage as knowledge.
- Generating data (addition): high-quality math, code and reasoning data is inherently scarce, and humans cannot write enough of it, so teams started generating it with models — but only with verifiable mechanisms, otherwise the model learns shortcuts.
- Mixing data (the core decision): the total token budget is fixed. Give code a little more and every other domain gets a little less. This is a zero-sum game, not an all-you-can-eat buffet.
The three steps are chained. Only after the first two do you have a pile of usable data; the third decides what the model studies each day and in what proportion. Many teams spend all their effort on the first two and then throw a mixture together at the last step — and the final result pays for it.
0101 Why cleaning data is non-negotiable
Using Common Crawl straight out of the box worked badly in the early days. Teams later found that exact deduplication, fuzzy deduplication, quality filtering and decontamination (to avoid test-set leakage) each brought measurable gains.
When Hugging Face built FineWeb and FineWeb-Edu, it pushed filtering and deduplication to the limit and ended up beating much larger, dirtier corpora with fewer tokens. Meta also used classifiers in Llama 3 to downsample over-represented categories such as entertainment.
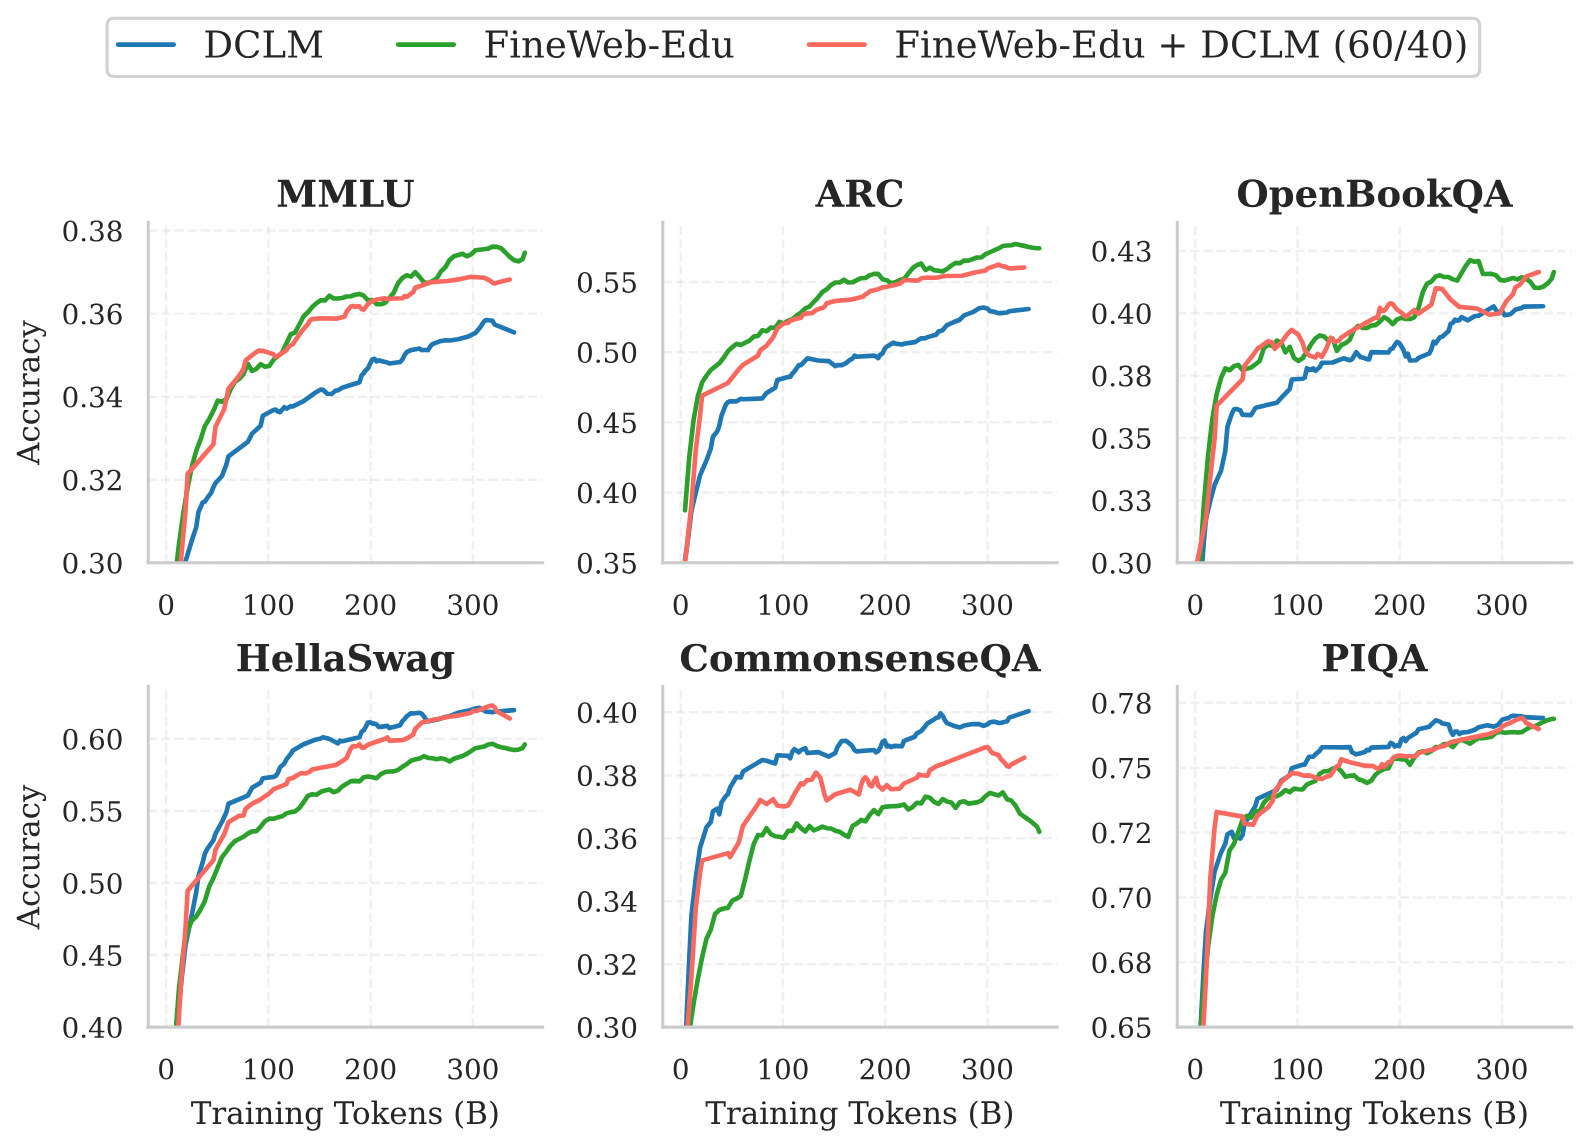
Six line charts titled MMLU, ARC, OpenBookQA, HellaSwag, CommonsenseQA and PIQA; x-axis Training Tokens (B) from 0 to 300, y-axis Accuracy; the three legend curves are DCLM, FineWeb-Edu, and FineWeb-Edu + DCLM (60/40).
Clean data is what makes mixing meaningful. If duplicates and junk are still in the corpus, no amount of ratio tuning will stop the model from learning noise.
0202 Where generated data stops helping
High-quality math and code data is scarce by nature. FineMath3+ and InfiWebMath3+ together hold only about 54B tokens, and high-quality multilingual corpora are far smaller than English ones. That is why teams began filling the gap with synthetic data.
But generation is not a free pass. In a large-scale experiment (over 1,000 models), Meta found that pure textbook-style synthetic data used alone produced higher loss across many downstream domains under small budgets; rephrased synthetic data blended with natural data consistently converged on an optimal share near 30%. Push it higher and diversity starts to collapse.
Marin recently noted that roughly 25% of its data is known to be AI-generated — but only on the condition that natural data still makes up a healthy share.
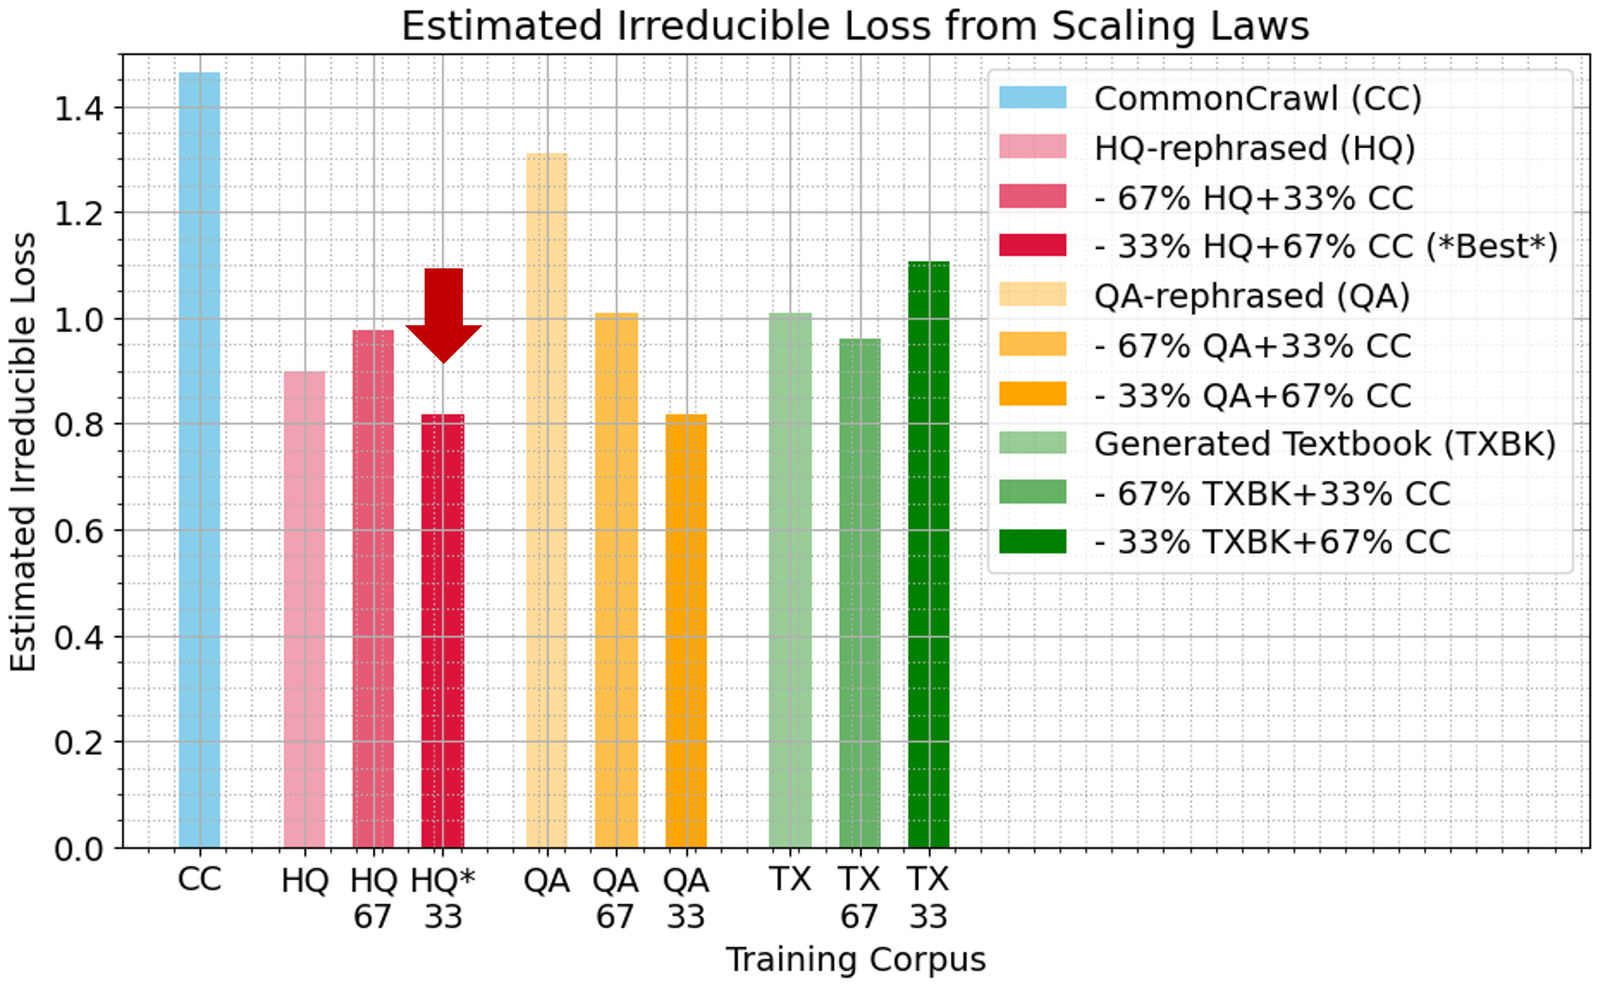
Bar chart titled Estimated Irreducible Loss from Scaling Laws; y-axis Estimated Irreducible Loss from 0.0 to 1.4; x-axis Training Corpus lists ten bars — CC, HQ, HQ67, HQ\*33, QA, QA67, QA33, TX, TX67, TX33. A red arrow points to HQ\*33; the legend lists the 67% / 33% blends of CommonCrawl (CC), HQ-rephrased (HQ), QA-rephrased (QA) and Generated Textbook (TXBK), with 33% HQ + 67% CC marked \*Best\*.
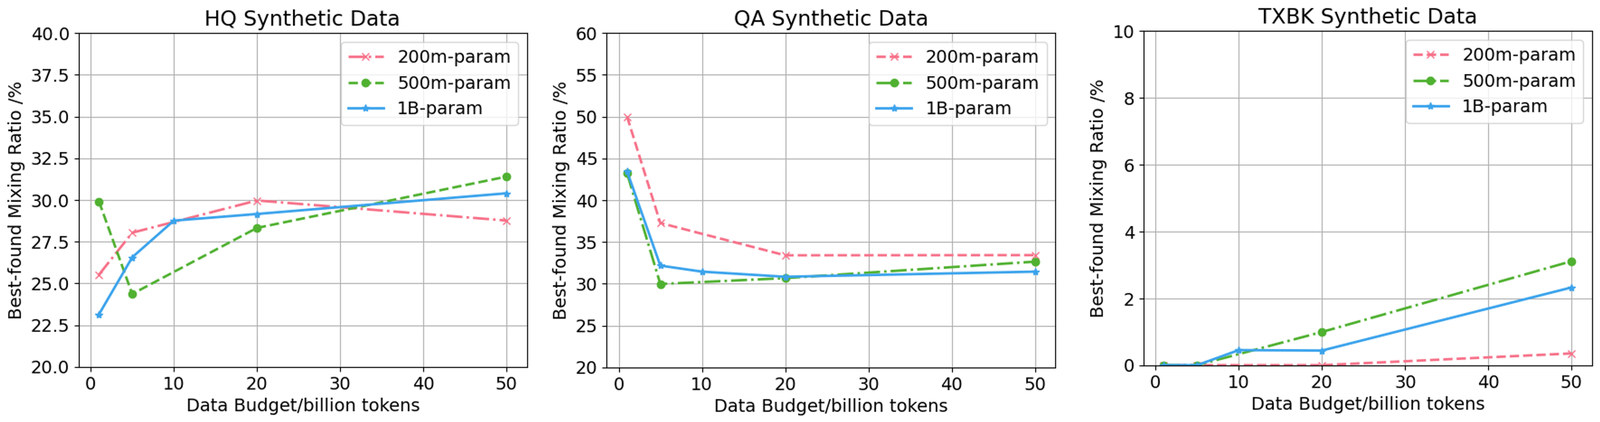
Three line charts titled HQ Synthetic Data, QA Synthetic Data and TXBK Synthetic Data; x-axis Data Budget/billion tokens from 0 to 50, y-axis Best-found Mixing Ratio / %; each chart has three curves for 200m-param, 500m-param and 1B-param; the first two use a y-axis of 20–60 while the third only 0–10.
The core of generation is verifiability. Without a verifier or a clear reference answer, models quickly learn to game the task. That is why high-quality reasoning data increasingly depends on generation pipelines with built-in verification.
0303 Why mixing is the hardest step
After cleaning and generating, the question becomes: with a fixed total token count, what share goes to web, code, math and multilingual data?
It sounds like grocery shopping, but it is really timetable scheduling. Language, math and English all matter, yet a day has only 24 hours; add an extra math class and English loses a slot. Large models work the same way: with a fixed token budget, raising one domain's share necessarily squeezes the others.
Worse, the ceiling on a mixture is set less by what you want than by how much unique, high-quality data you actually hold. Push math past a certain share and it gets trained for many epochs; the model starts memorizing problem statements and answer distributions instead of learning transferable reasoning. The same holds for multilingual data.
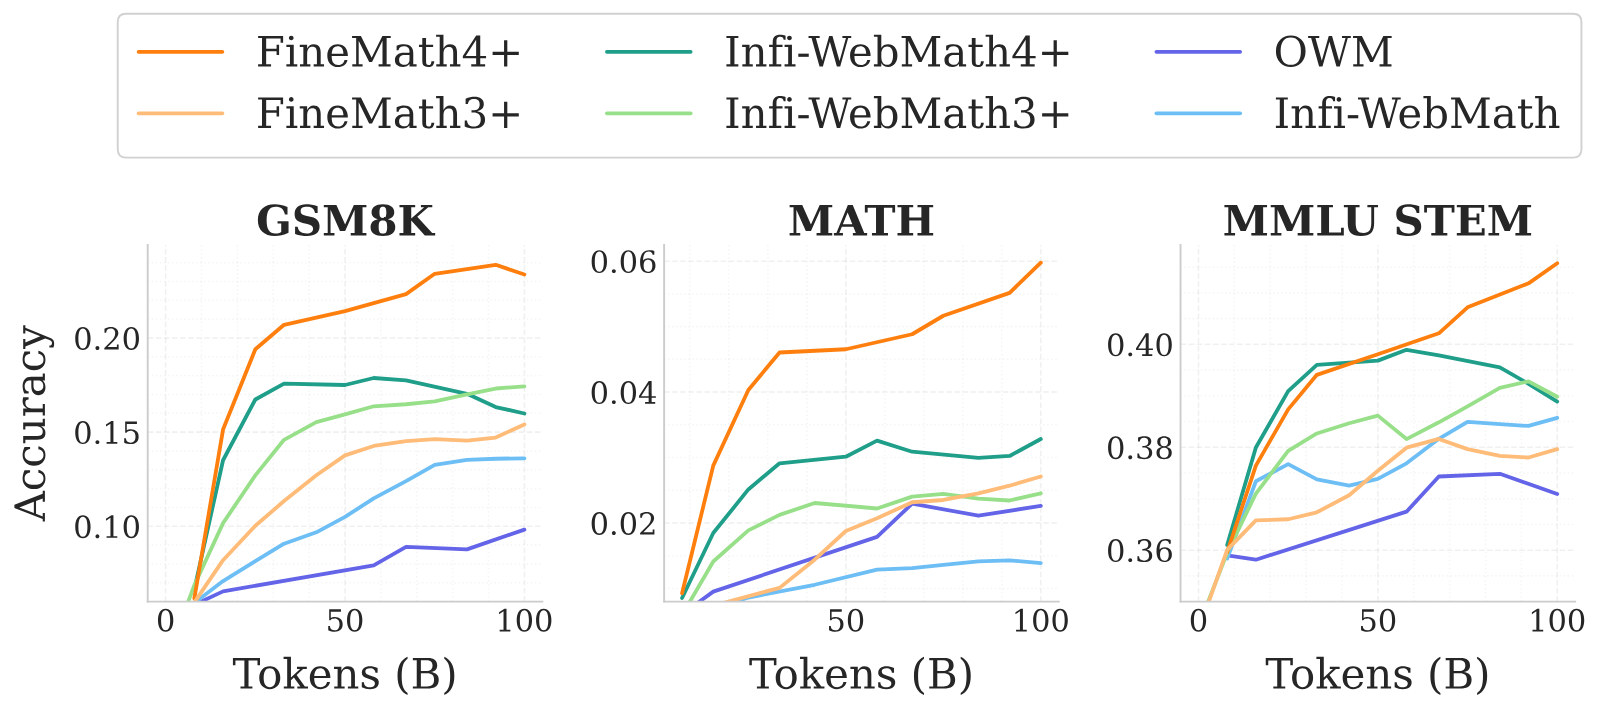
Three line charts for GSM8K, MATH and MMLU STEM; x-axis Tokens (B) from 0 to 100, y-axis Accuracy; six curves labeled FineMath4+, FineMath3+, Infi-WebMath4+, Infi-WebMath3+, OWM and Infi-WebMath.
SmolLM3 is the most detailed public case. Its first stage tried 25% code and English benchmarks clearly dropped; the team settled at around 10%. Math stopped at 3% because that was all the inventory allowed. Multilingual ablations landed at 12%. These numbers were not guesses — they came from repeated ablations on a 3B model.
But Smol is only the version an open-source team can say out loud. Inside large labs the picture is more complex: Llama 3 ended up around 50% general, 25% math and reasoning, 17% code and 8% multilingual, with the mix adjusted dynamically during training. OLMo 2 explicitly used two stages, switching to a higher-quality mixture in the late annealing phase.
In the next part we take mixing apart: why data is released in stages, how annealing ablations save money, why automated mixture algorithms still cannot replace human judgment, and the hidden engineering traps — such as where loss spikes actually come from.
Those are the things that really decide how the finished model feels in use.
About DataMining Founded by a team of PhD students from the Software Institute, School of Computer Science, Peking University, we build original high-quality task data and executable evaluation environments for large models and agents. We deliver not only data, but industrial-grade Rubric and Harbor Task verification systems. ▸ Long-horizon code and engineering simulation: Deep SWE, Frontier SWE, Frontier-Eng, ALE / Terminal-Bench and more, supporting 200 tasks per week with stable delivery in 7 working days. ▸ Extreme math & science and professional Agents: a strict multimodal HLE production line (5,000+ tasks in stock); Harvey LAB, Automation Bench, Toolathlon, plus 35+ atomic-level Rubrics industry workflow packs. ▸ System infrastructure and embodied real machines: standardized Win11 / Ubuntu desktop Agent VM images, plus million-scale embodied-intelligence Grounding / SFT / DAgger real-machine custom production lines and cyber data. All research, datasets and benchmarks cited here are public third-party work; we only align with their capability requirements and difficulty ranges and do not copy their tasks. Capability descriptions in this article are our internal same-criteria conclusions and do not represent official third-party conclusions. 🌐 Website: datamining.cloud | 📮 Sample requests and technical contact: contact@datamining.cloud
📚 Figure Sources
[1] SmolLM2: When Smol Goes Big — Data-Centric Training of a Small Language Model, arXiv:2502.02737, Figure 4
[2] Demystifying Synthetic Data in LLM Pre-training, Kang et al., EMNLP 2025, arXiv:2510.01631, Figure 3
[3] Demystifying Synthetic Data in LLM Pre-training, arXiv:2510.01631, Figure 4
[4] SmolLM2: When Smol Goes Big — Data-Centric Training of a Small Language Model, arXiv:2502.02737, Figure 1